Research and Products
cloud feedbacks, deep-convection, climate dynamics
Data and Scripts
Post-processed data and scripts for calculations and plots used in Wing et al. (2020) and Stauffer and Wing (2022) can be found on GitHub.
- Post-processed data
- Calculations
- Example Notebooks
- Images
Cloud feedbacks in RCEMIP
Clouds have consistently been the source of greatest uncertainty in climate sensitivity estimates. My current research involves an in-depth look into cloud feedbacks as they appear in RCE models. We hope high-resolution idealized modeling of deep-convective clouds will allow experts to further constrain the feedbacks calculated by climate models.

Controls of deep-convective clouds
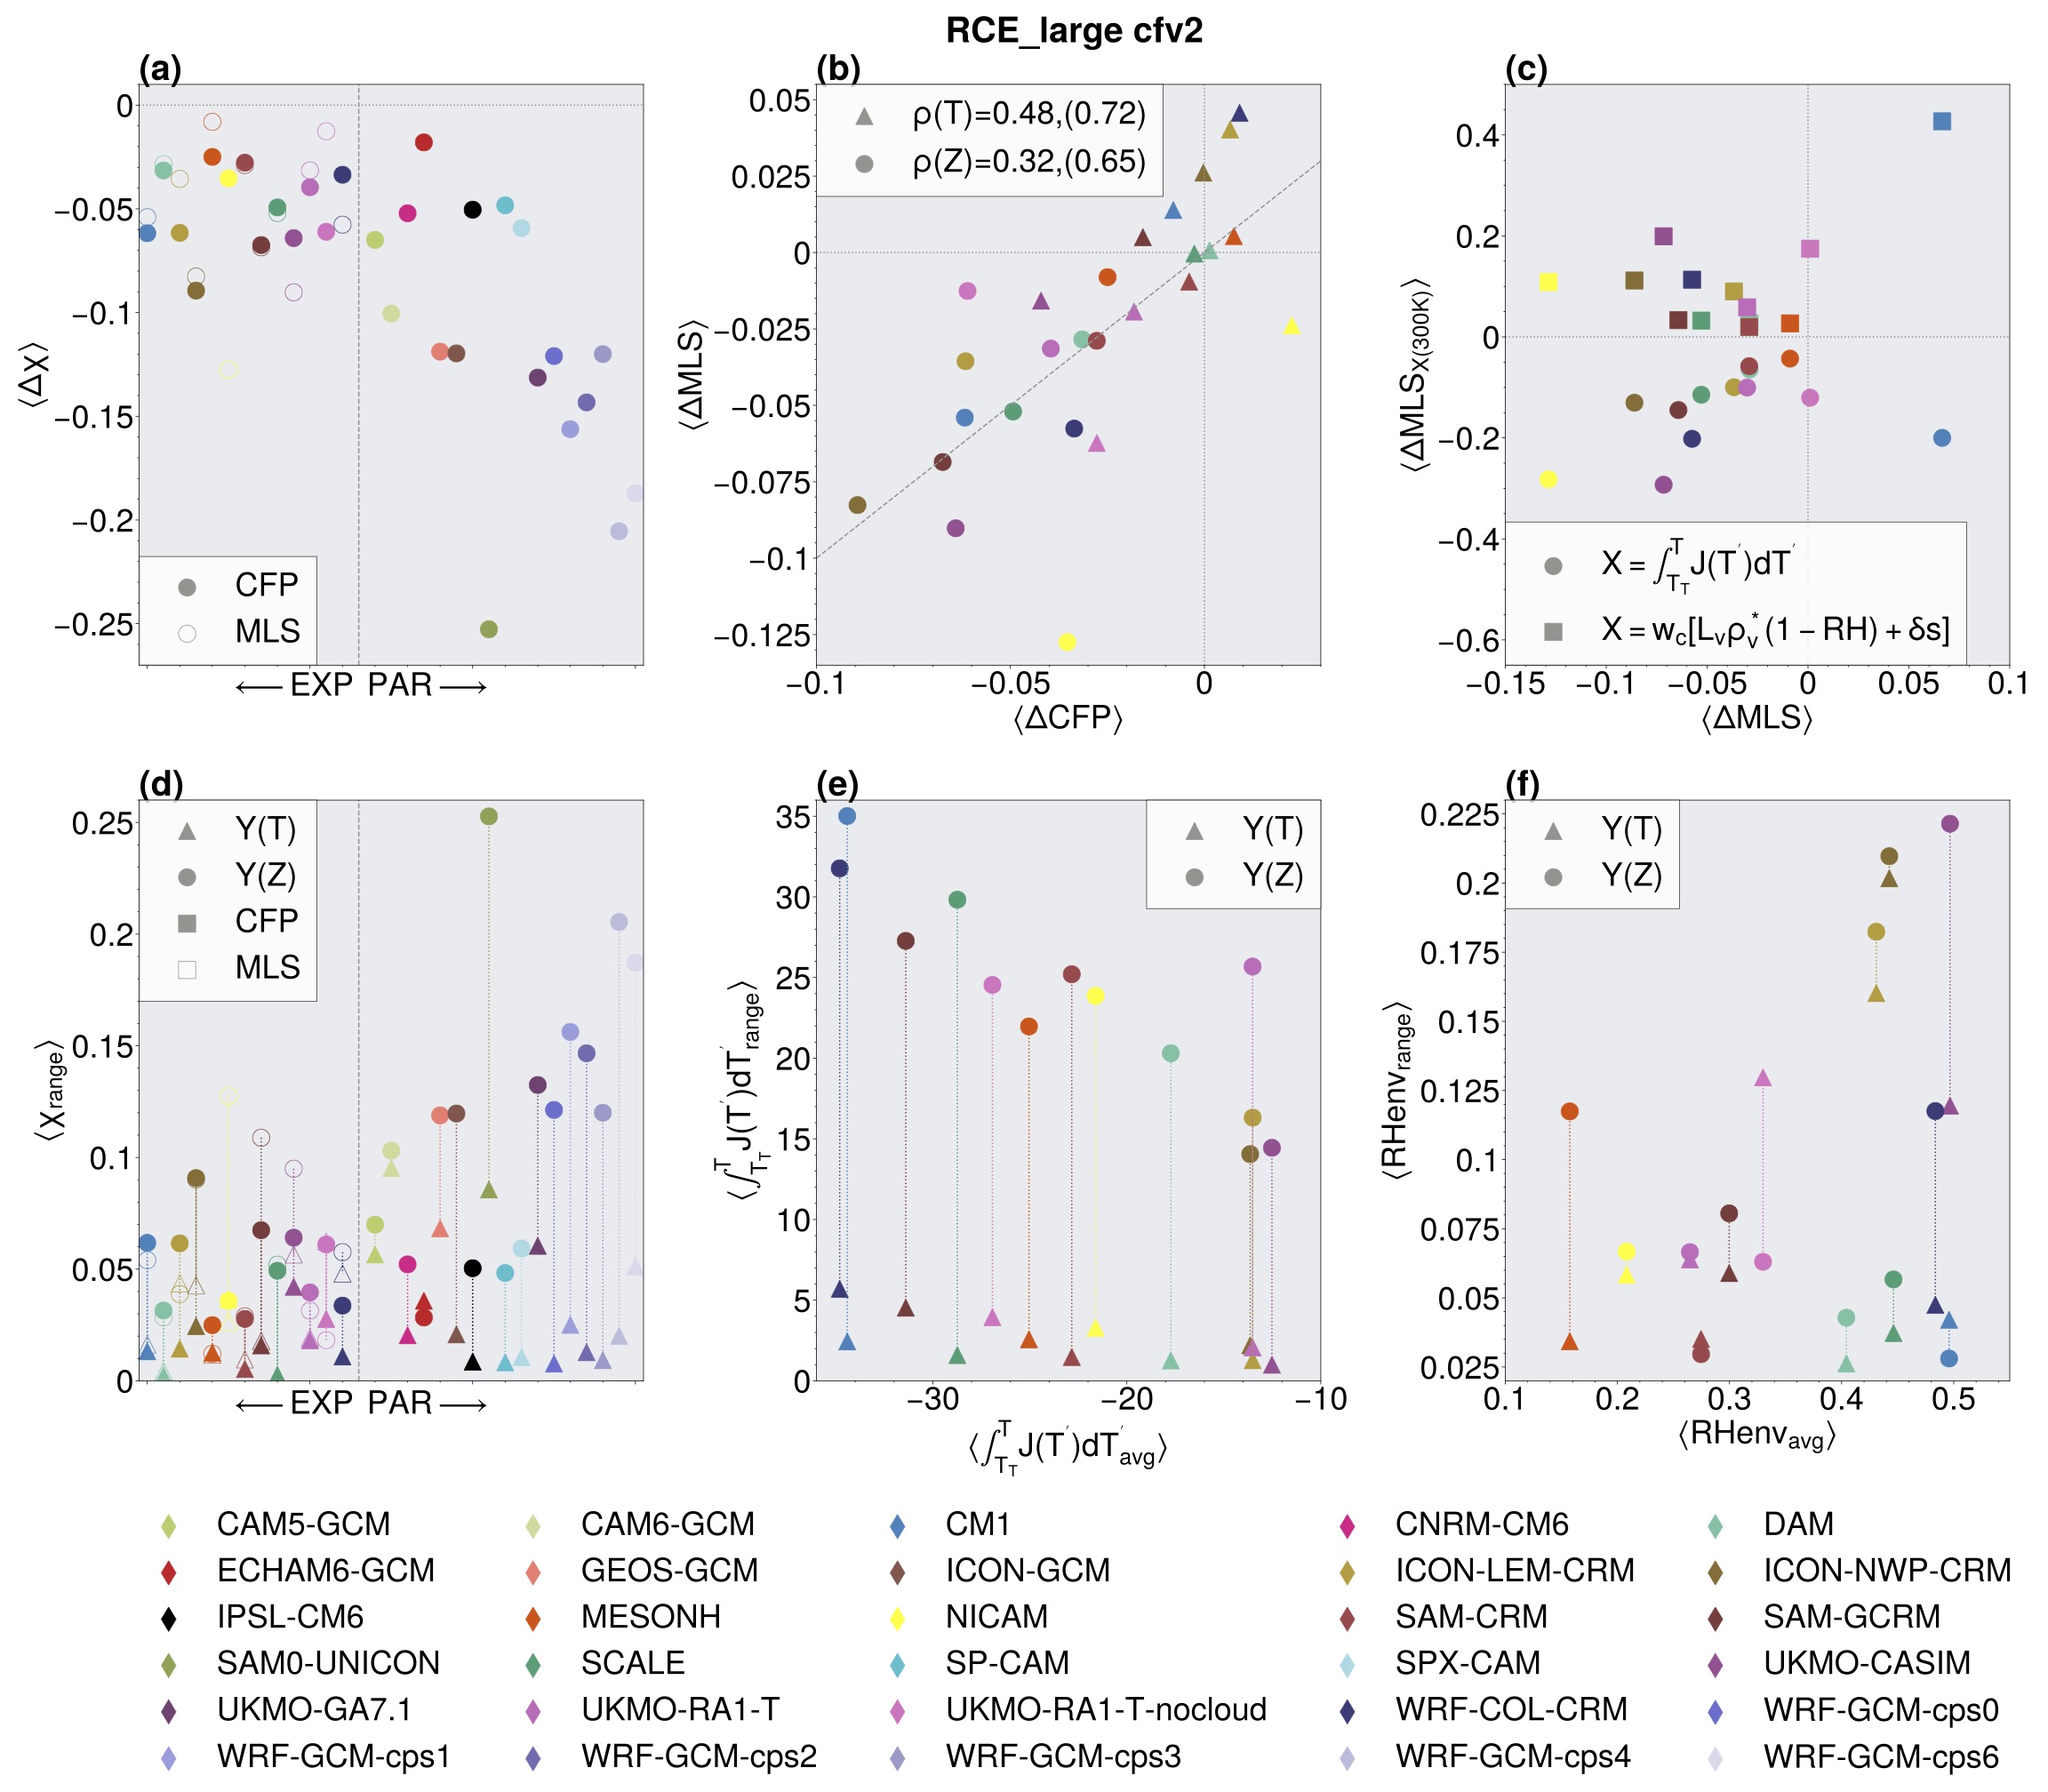
In Wing et al. (2020) we found that, in agreement with RCE literature, deep-convecting anvils increase in height, slightly increase in temperature, and, generally, decrease in coverage with warming SST. In Stauffer and Wing (2022) we analyze in more detail these responses and the underlying physical mechanisms governing their behavior. Primarily we showed that anvil coverage decreases primarily due to the increase in stability in a warmer climate. We also looked at the physical mechanism governing mid-level clouds (left, Figure 9 from Stauffer and Wing, 2022) where the decrease in clouds is due to a quicker increase in convetive heating than the rate of increase in the integrated radiative cooling rate.

The Radiative-Convective Equilibrium Model Intercomparison Project
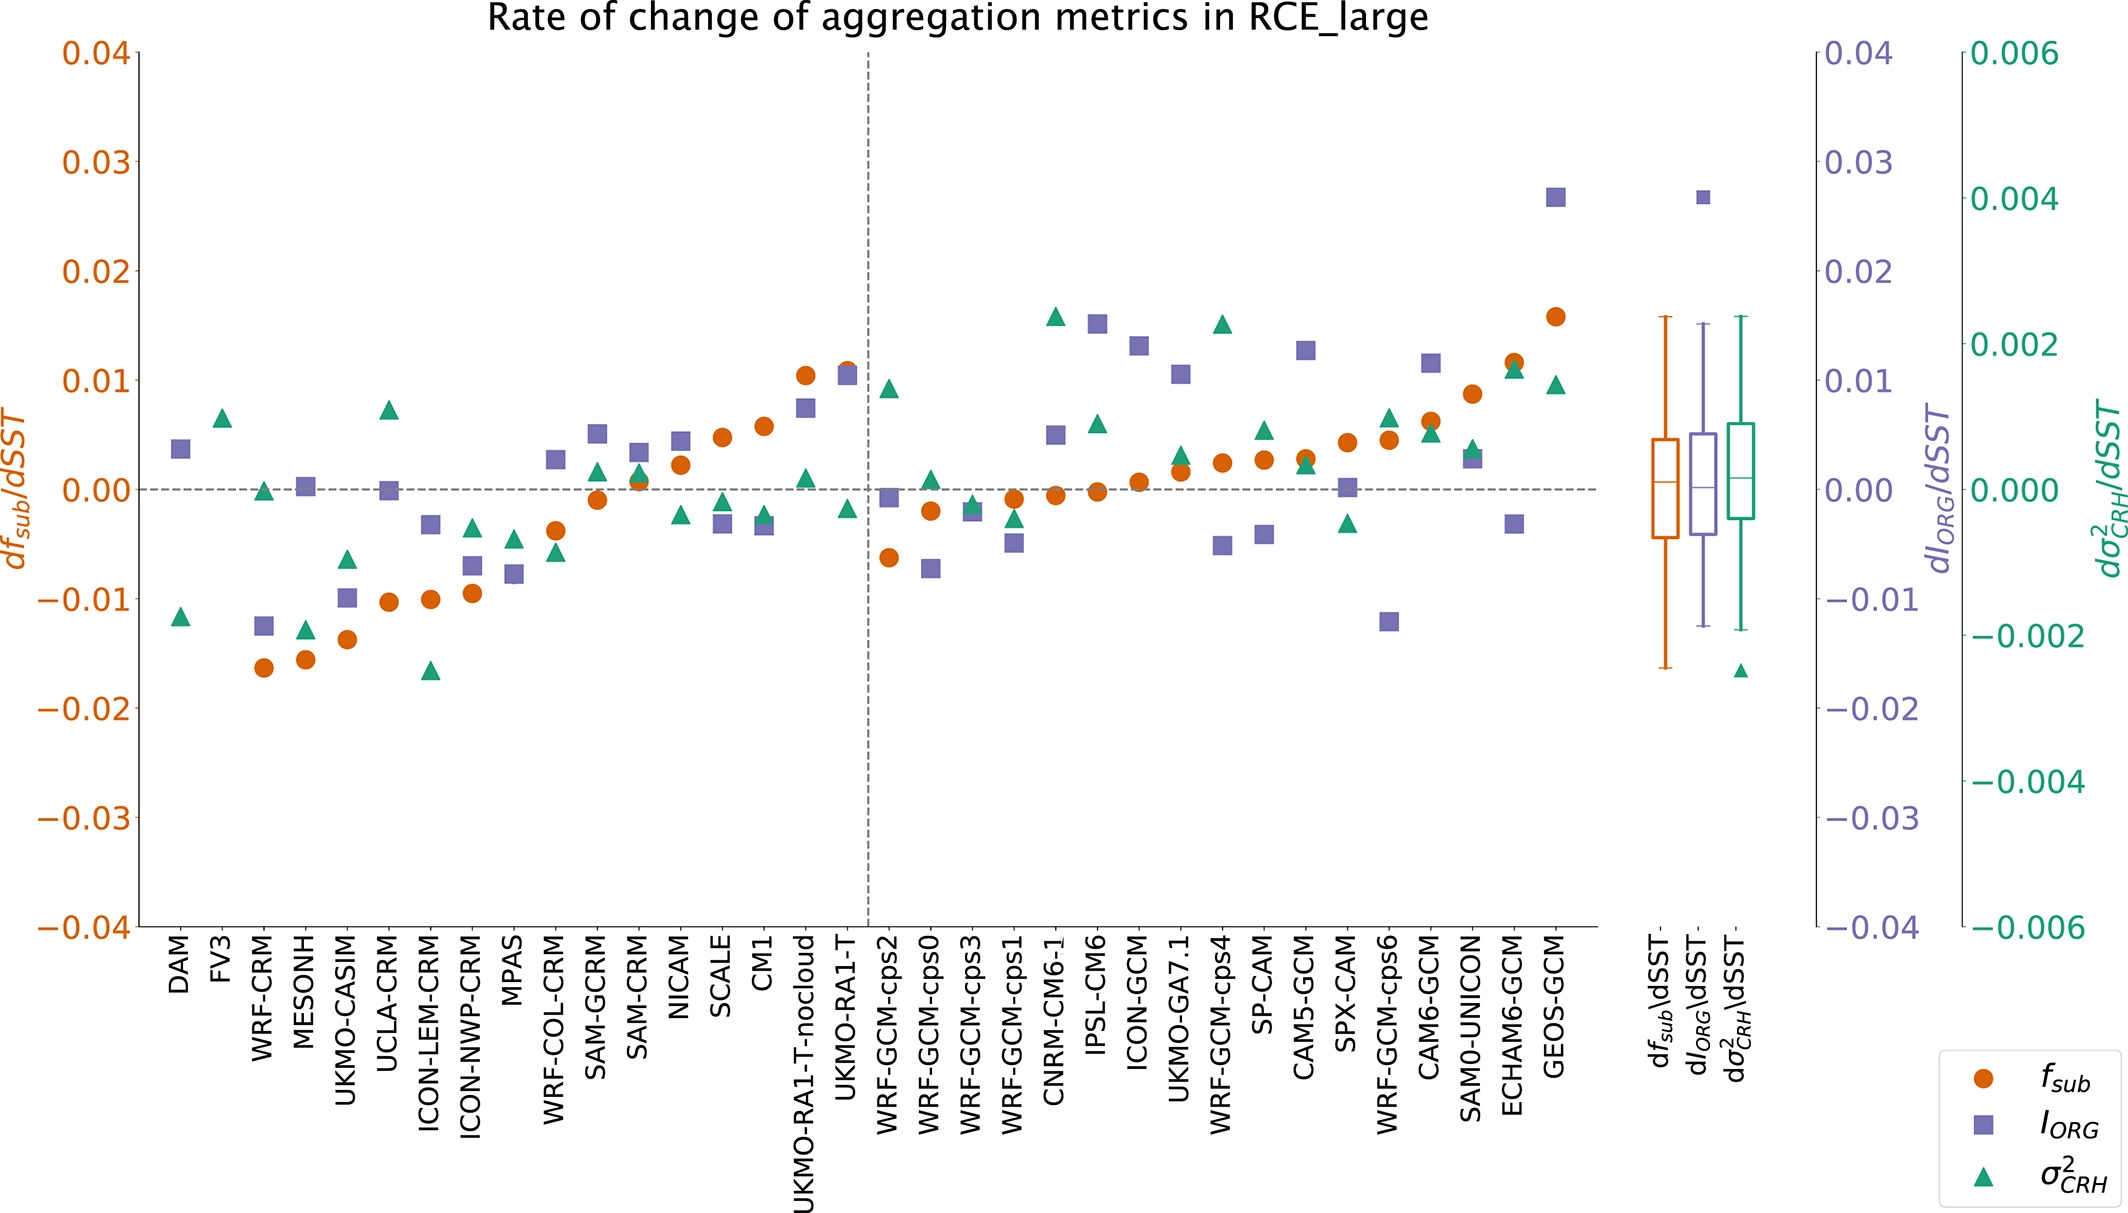
The Radiative-Convective Equilibrium Model Intercomparison Project (RCEMIP) is a MIP consisting of over 30 models commonly configured using the RCE framework. An overview of the basic climate, cloud properties, convective-self aggregation, and climate sensitivity is described in Wing et al. (2020). We found that the equilibrium climate state and atmospheric profiles vary greatly across the models. Similarly, although self-aggregation is present in all (but one) models and that self‐aggregation dries the atmosphere and reduces high cloudiness, there is no consistency in how self-aggregation changes with warming SST. The figure to the right is Figure 16 from Wing et al. (2020) and shows the rate of change in convective self-aggregation using three different metrics quantifying self-aggregation for all large domain models in RCEMIP.